
Your World Visualized
data management, analysis, and presentation
Whether you need a quick location map illustrating project boundaries, in-depth analysis of long-term data, or design input for complex problems, jenComp can lend a hand.
Solutions than span industries
The most compelling aspect of environmental science in today's technology infused world is how data can drive solutions on scales from miniscule to global. Modeling can be used to predict the behavior of a simple, enclosed system or to determine effects on a regional, continental, or worldwide scale. With the advent of smart cities contributing to the pool of information that comprises Big Data, tracking and analyzing trends can be useful in niches previously unnoticed.
"Hiding within those mounds of data is knowledge that could change the life of a patient, or change the world."
Atul Butte Stanford University
Areas of Expertise
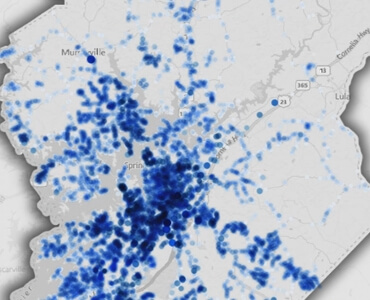
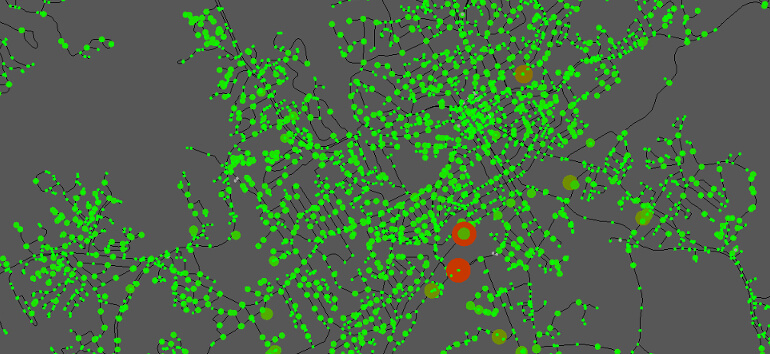
GIS for Presentation
Useful graphics needn't be drab. Geographic Information Systems (GIS) can act as a tool for the illustration and organization of geo-tagged data, getting your project on the map. Static showcases, interactive applications, and dynamic presentations are all readily available through open source or enterprise level tools.
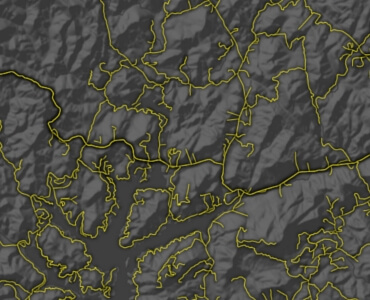
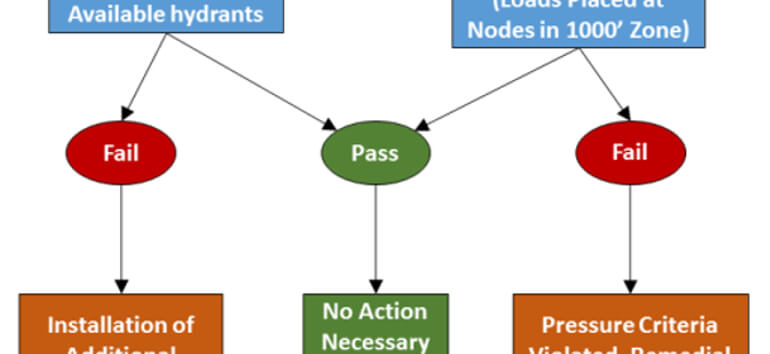
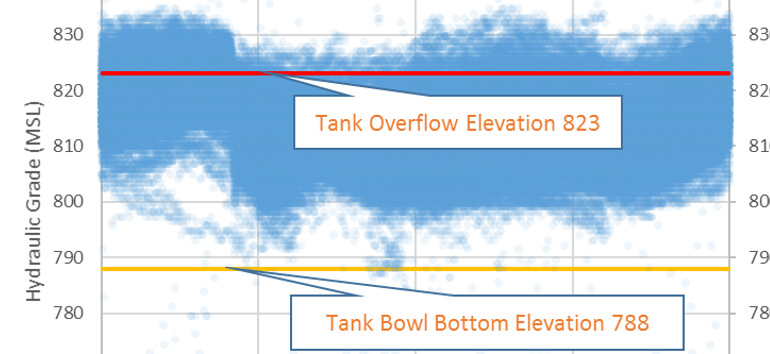
GIS for Modeling
From the small scale to regional coverages, GIS can be used for either direct input or environment creation in mathematical models. Either for specific case scenarios or longer range planning, these models help make informed decisions for budgeting, spending, planning, or response.
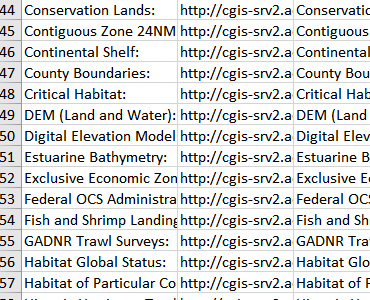
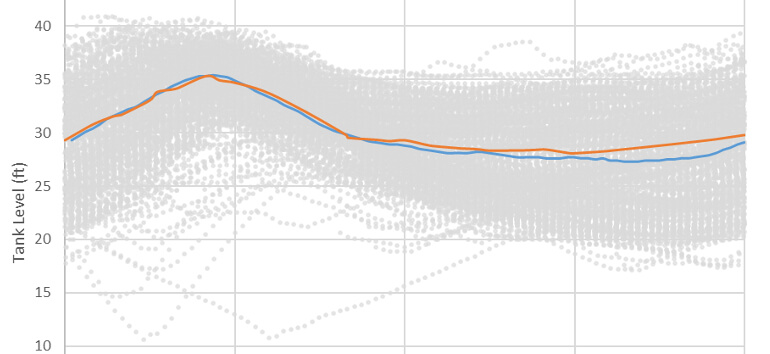
Data Analysis
Time series and trend analysis can be used to discover trends and patterns. Visualizing these patterns can be an additional lens that allows for further intepretation, illustrating ideas not appearant in spreadsheets and databases. Attractive imagery can be used for presentations and illustrations on the web or at a podium.


