
Your World Visualized
Hall County Water Demand
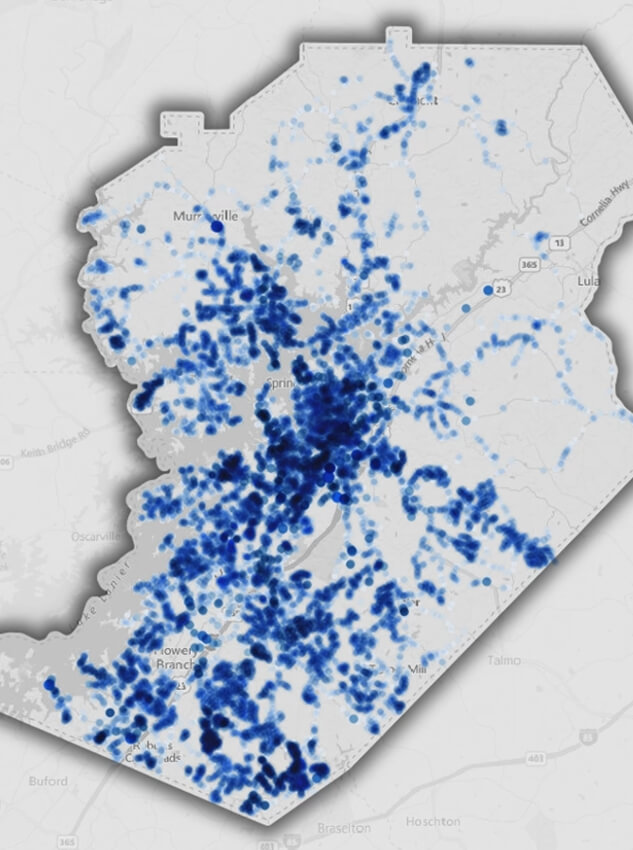
Visualizing Seasonal Variation in Water Usage
Customer billing data serves as an input and boundary condition in water distribution system hydraulic models. Determining the total load on a system is one of the fundamental purposes of water system modeling. Customer use varies with time of day and time of year; these variations are often distilled down to a daily average. This Average Daily Demand works as a base test case for system improvements and infrastructure planning. Usage records in tabular format were used to create a short animation of demand variation, visualizing both demand hot spots in the system and how the load changes with the seasons.
Date:
2017Performed For:
Gainesville / Hall County, GA via Wiedeman & SingletonTags:
Presentation, GISTools:
Access, QGIS
Watch the Video
Back to Project Gallery


